Solar + energy storage key to savings for Central West feedlot
Download a PDF version of this information paper.

Gundamain Feedlot has identified an opportunity to combine battery storage with solar PV to maximise the savings it makes from solar. “Our first reaction was ‘no way’, given the large upfront capital cost, but with a potential positive cash flow financing options, we decided to investigate how the business case may play out,” say owner-managers Andrew and Tess Herbert.
Other initiatives identified on site and discussed below include power-factor correction, and tractor set-up and operation.
Energy needs on a feedlot
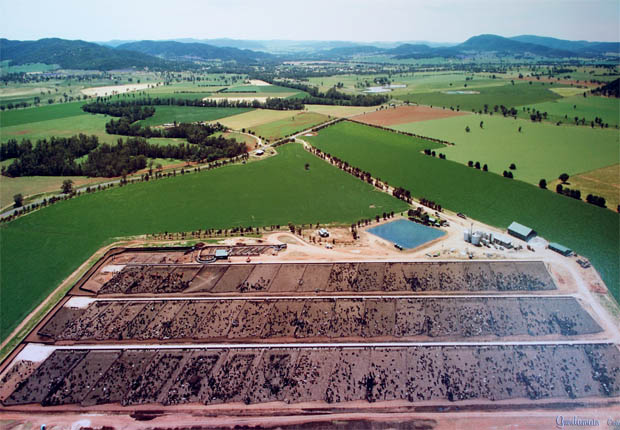
Tess and Andrew Herbert own and manage a 4,000 acre/6,000-head cattle feedlot in central New South Wales. Cattle are shipped in and out daily, typically spending between 70 and 100 days on the property before being sent to a local abattoir. NSW Farmers’ Energy Innovation Team visited the site in May 2014 to identify and quantify potential energy cost saving opportunities.
In addition to hosting cattle, a large portion of the property is used for growing grain feed and silage: an essential part of cattle feed. Diesel is required to run tractors for sowing, harvesting and other cropping tasks as well as for vehicles used to transport feed and cattle. The largest user of electricity on-farm is the feed mill, which uses a process called ‘tempering’ to wet the grain before grinding and mixing it with silage and other feed products. As the feed needs to be mixed daily for the cattle, the mill operates between six and seven hours every day of the year, from around 6am till 1pm. These operating times are not very flexible, due to labour constraints and the need to optimise feeding times for the herd. The farm also uses electricity to run pumps, which provide water for the animals to drink and for irrigating crops.
Gundamain's energy profile
The feedlot’s energy costs exceed $200,000 p.a., with loaders and excavators dominating diesel use and the mill and pumps drawing the most electricity (see tables below for details).

Table 1: Gundamain’s energy breakdown
NSW Farmers

Table 2: Gundamain’s energy breakdown by end-use purpose
NSW Farmers

Figure 1: Gundamain’s energy use ‘baseline’ by type and purpose
NSW Farmers
Cost reduction opportunities
A total of 12 energy savings opportunities were identified by the NSWF Energy team, with the potential to save Gundamainmore than $75,000 p.a. in energy costs. Seven have been prioritised for potential implementation with assistance from NSW Farmers. Solar panels, tractor set-up and Power Factor Correction (PFC) provide the focus of this case study. These opportunities are highlighlighted in Table 3.

Table 3: The full list of opportunities identified at this site. Note: ‘UI’ indicates ‘Under Investigation’.
NSW Farmers
After a tour of the facility and a review of the site’s energy baseline data, the NSW Farmers Energy team and the Herberts discussed their business plans and energy innovation priorities in a 2.5-hour workshop. The priorities they identified included:
- solar PV options, possibly with storage;
- correct tractor set-up and operation: ballast, tyre pressures, reduced movements and idle time;
- power factor correction (PFC), to lower demand charges and reduce energy wastage in the form of unwanted heat;
- shifting the time of use of the creek pump to coincide with less costly electricity supply times; and
- a review of electricity contracts, including:
- tariffs and demand management options
- the value of moving from a short-term to a long-term contract and locking in a lower price; and
- consolidation of electricity accounts to save on network charges – for instance, one account is currently costing Gundamain $400 a quarter with no electricity used over the period.
The first three priorities are the focus of this case study.
| Although electricity use is consistent, solar PV provides a limited opportunity, if implemented without load shifting or battery storage. |
As shown in Figure 2, Gundamain Feedlot runs a very repetitive, consistent operation, which means that energy demand is often predictable.

Figure 2: Average daily electricity use at Gundamain Feedlot. The consumption profile is characterised by a reccuring daily load of 75kW sustained from around 5am to noon.
NSW Farmers
This type of operation is often a good candidate for solar but unfortunately, the majority of the mill’s electricity is needed before peak sunshine is available, which limits the savings potential of a PV system. Nonetheless, these savings can be increased or optimised through one of the following options:
- sizing the PV system to supply a consistent portion of baseload electricity use;
- shifting major electricity use to sunshine hours so that a larger PV system is viable; or
- using a large battery bank to store power from a PV system and deliver it to the feedlot when it’s required.
These options are explored in the following section.
Gundamain’s three business cases for solar
Size for baseload (40kW PV system)
The simplest solution for Gundamain is to install a PV system sized to meet its baseload electricity use, as shown in Figure 3.
With the load profile skewed towards the very early morning hours and dropping off from 1pm, a system much larger than 40kW will result in relatively large exports of solar-generated electricity, fed into the grid for very little, if any return.
A 40kW system could save the facility around $8,000 a year. Solar power would provide around 15% of the load, given the feedlot’s daily electricity profile, but would save only 10% of the cost due to the high demand charges (around 50% of the bill) determined by peak load each month. Solar PV has a limited capacity to reduce demand charges, as one cloudy day in a month could result in significant charges being triggered.

Figure 3: Without load shifting, 40kW is the largest a PV system can get before its financial case will deteriorate.
NSW Farmers
- Estimated cost: $70,000
- Expected yearly savings: $8,000-$12,000
- Simple payback period: 6-9 years
Shift electricity consumed to maximise daytime load (100kW of solar PV plus load-shifting by 3-4 hours)
As solar power generation is optimised between the hours of 9am and around 4pm in the central west region, peak rates of electricity supply (not peak demand) can be less of a concern if solar capacity is able to cover this time of use.
Therefore, a measure that could result in substantial savings but is perhaps unachievable would be to restructure the feedlot’s operational regime so that milling and other related works begin approximately four hours later in the day. Shifting the start times of major operations forward from 5am- to 9am and ending the day’s main operations at 4pm instead of noon would provide a strong financial case for installing a larger solar PV system of 100kW, as it would then match peak energy consumption for the feedlot very closely (as seen in Figure 4).
This solution would likely generate the greatest savings for a relatively modest investment. Shifting operations forward four hours may not be feasible for Gundamain, however, as the feedlot requires that the feed be ready early in the day.

Figure 4: Possible daily electricity use at Gundamain if operations were shifted to four hours later. With operations occuring later in the day, a bigger PV system of 100kW would be viable and would result in substantial savings.
NSW Farmers
- Estimated cost: $135,000
- Expected yearly savings: $23,000-$30,000
- Simple payback period: 4-6 years
70kW solar PV system +360kWh battery storage
A more ambitious solution would be to install a solar PV system (70kW) and a large 360kWh battery. The battery would then be able to charge using sunshine or off-peak grid electricity and could provide power when direct solar energy is unavailable – in the early mornings, when the mill is required but the power of the sun is inadequate to generate sufficient energy. Combined with power factor correction, the savings from taking advantage of this opportunity could amount to $50,000 p.a.
, the battery will replenish its charge using low-cost electr")
Figure 5: Possible daily electricity use at Gundamain if a 360kWh battery is installed and combined with a 70kW PV system. During off-peak times (10pm to 7am on workdays and all day on weekends), the battery will replenish its charge using low-cost electricity. Additionally, when the solar PV system generates power in excess of Gundamain's electricity needs, the surplus energy can be used to charge the battery. The battery can then be used to help supply power during peak hours and reduce peak grid demand.
NSW Farmers
- Estimated cost: $400,000
- Expected yearly savings:$36,000-$45,000
- Simple payback period: 9-11 years
While this solution is currently too expensive to be viable, trends in battery prices suggest it may be so in the near future.
Integrating PV and energy-efficiency financing
Gundamain is currently installing shading on its existing cattle feedlots, and this raises the possibility of constructing this shading with integrated solar PV panels. Other feedlots have successfully implanted solar PV integration in sheds (see Figure 6) but new fit-for-purpose structures could also be explored (see Figure 7).
")
Figure 6: Cattle feedlot and solar PV array in Ontario, Canada. Photo by Mary Goode (ABC, 2011)
NSW Farmers
")
Figure 7: Potential shade and solar integrated structure (Scott’s Contracting; St Louis Renewable Energy, 2014)
NSW Farmers
While the capital cost for a simpler shade with no solar PV panels will be lower, it will not attract the incentives and support that apply to investments in energy efficiency such as those shown in the following table.

Table 4: Comparison of cost and benefits from an integrated solar project versus a non-energy-related capital investment
NSW Farmers
For more information on financing energy related investments, have a look at the NSW Office of Environment and Heritage’s energy finance guide.
Correcting the ballasting and tyre pressures on farm vehicles can save five to 20 percent on diesel costs, depending on current practices
Gundamain produces silage for cattle from its own cropping operation, which surrounds the feedlot. Therefore, a large portion of the business’s energy use relates to the diesel used to power tractors, loaders and excavators.

One way to reduce the fuel used by these machines involves optimising their tyre pressures and ballast set-up. With appropriate action from tractor operators, monitoring wheel slip and using the correct gear for each given application can result in fuel savings of between five and 20 percent.
What is an appropriate wheel slip level?Wheel slip is one of the most important variables in assessing the efficiency of traction and correct operation of the machine. Many operators may mistakenly believe that zero percent wheel slip is optimal but this is rarely the case for most field operations. Although there are differences in opinion regarding the most appropriate level of wheel slip, several sources suggest that the optimal wheel-slip range is between eight and 15 percent. This range is considered ideal for balancing fuel efficiency and the longevity of the drive train and tyres. |
Tess and Andrew Herbert are interested in reviewing whether the tyre pressures and ballast points for their site tractors, loaders and excavators are optimal. Currently there are no monitoring practices in place. They plan to add set-up and operating procedures to checklists for daily/weekly checks and induction for new employees. This action should deliver savings of around $2,000 per year at a cost of $1,500 (nominal) with a payback period of eight months or roughly one season.
For more information, refer to the quick tips overleaf or to NSW Farmers’ information papers on the topic:
- ‘Tractor Ballasting’;
- ‘Tyre pressure and fuel efficiency’;
- ‘Monitoring wheel slip to achieve fuel efficiency’; and
- ‘Energy Efficiency for Farm Vehicles’.
Quick tipsReview your tractor set-up. Ensure that the weight/tyre pressures are correct for the task. Install a performance monitor. If you don’t already have one fitted, consult your dealer about installing a groundspeed radar/slip monitor (many tractors have such equipment or can be retrofitted in the field). Calibrate existing equipment. For tractors already equipped with radar, ensure that any required calibration is carried out prior to usage. Provide training. Ensure that operators are aware of any performance monitors on the tractor and that they know how to use them. Inspect field conditions. Review field performance by conducting regular in-field inspections for tractor operation and soil conditions. Inspecting tread marks may not provide a highly accurate estimate of wheel slip, but should allow a farmer to spot instances of over- or under-ballasting. |
Correcting the power factor reduces electricity waste and saves thousands of dollars a year
What is power factor correction (PFC)? A quick analogy…Some farmers are unaware that their electricity bills can be reduced by improving the ‘power factor’ (PF) of their facilities. A poor power factor is analogous to a beer with too much head, where the head represents wasted energy. For sites with large electricity usage, electricity network operators will typically impose a demand or capacity charge to reflect the overall amount of power supplied to the site (including the potential wastage arising from a poor PF). Installing power factor correction devices can help ensure that on-farm electrical equipment uses power provided by the network efficiently, and that as a result, excessive power usage charges are not applied. In the case of the beer, you pay only for the actual beer you drink. |
For Gundamain, a look at the site’s electricity bill shows that demand charges represent around 50% of the site’s monthly bill. There is a need to determine the current power factor applied and whether there is potential for cost-effective optimisation of the power coming onto the site. This is worth investigating, with potential savings of $6,000 per year on offer. The cost of the capacitors that would be needed to improve Gundamain Feedlot’s power factor is $24,000, which would be paid off in around four years, with ongoing savings of $6,000 per year for the life of the capacitors. This work should be done before the solar PV and/or battery install so the savings and sizing can be matched with changes to grid-delivered load. Note: To calculate the amount of power generation required accurately, use real power required rather than total power delivered.
Quick tips for investigating power factor correction
- Check your bill for a kVA charge. If no kVA charge is shown on the bill, then no action may be required.
- Check your power factor rating (PFR). The actual power factor value is sometimes shown on the bill, but you may need to analyse your metering data to identify it correctly.
- Estimate savings. If your power factor is below 8 (and kVA is charged on the bill), ask your retailer business how much you might save if you were to increase it to 0.95.
- Obtain a quote for installing capacitors. Typical costs are $2,000-$3,000 for a small bank of capacitors. Typical low-voltage costs are between 70/kVAr and $100/kVAr.
- Check your maximum peak demand. Talk to your retailer or meter data agent about this.
See NSW Farmers’ Power Factor Correction information paper for more detailed information.
Other possible solutions
As do many of the farms visited under the NSW Farmers Energy Innovation Program, Gundamain Feedlot has an opportunity to examine its existing electricity accounts with regard to possible rebates and network rates/tariff structures. The Herberts have a number of meters on their property, charged at a variety of rates. Bundling these rates may provide them with significant energy cost savings. Other opportunity the Energy team identified as part of its Gundamain site assessment included shifting pumping times to off-peak periods and taking advantage of lower electricity rates.

Figure 8: Expected energy savings from continuing implementation of projects at Gundamain
NSW Farmers
Outcomes for feedlot: a more sustainable future with cost and environmental benefits
Solar PV, discounted electricity prices, PFC and improved tractor set-up will save Gundamain Feedlot just over $60,000 year on year. This represents around $300,000 over five years or around 20% of the operation’s energy costs per year.
Step change in energy management at Gundamain requires thoughtful business case development
The Herberts will continue to explore and seek greater understanding of the business case for investing in solar PV technology and the different PV configurations available. Steps will include:
- refining the sizing of solar panels and batteries to maximise the offset of grid-delivered power and peak demand charges (storage-dependent);
- looking into various solar/storage combination specifications and approaching three or more installers to obtain quotes and ascertain the best price for the job;
- quantifying the potential savings and contingencies for going off-grid – calculating NPV so that this value is better understood and can be quoted to financiers;
- identifying a lender for an Energy Efficiency Loan and incorporating Small-scale Renewable Energy Certificates into the business case;
- facilitating a decision on the feasibility of the project;
- investigating any supplementary financing opportunities available from CEFC that may be enable the Herberts to extend terms and improve cash flows;
- investigating supplementary funding options from state and federal government bodies for capital expenditure for innovative infrastructure; and
- investigating potential support from MLA and/or AMPC; and
- collating and refining their business case and approaching lenders with a solid final proposition.
More information
- Solar shade case example
scottscontracting.wordpress.com/2014/05/01/solar-power-feedlot-sun-shade/#comments
-
Standards for heat stress and shade in feedlots
www.animalwelfarestandards.net.au/files/2011/02/Beef-Cattle-Feedlots-discussion-paper-1.3.13.pdf -
Finance guide to improve business case for energy-related investments
www.environment.nsw.gov.au/business/project-financing.htm